10 iftop Command Examples in Linux
System monitoring is a critical role that any sysadmin should undertake to ensure that systems and applications are running as expected. We have covered a few monitoring tools in the past including glances real-time monitoring tool and top command which provides detailed information about running process and other metrics such as uptime, CPU and memory usage.
Iftop is yet another monitoring tool that monitors network bandwidth in real-time. It captures total inbound and outbound data packets flowing through a network interface and displays the total bandwidth usage. In this guide, we walk you through the installation and the usage of the iftop command-line tool.
How to install iftop on Linux
Before we go any further, we need to install the bandwidth monitoring tool. And here’s how you can do it on various Linux distributions.
Install iftop on Ubuntu / Debian distributions
For Ubuntu and Debian-based distributions, run the command:
$ sudo apt-get install -y iftop
Install iftop on CentOS/RHEL/Rocky Linux
For RHEL-based distributions such as Rocky Linux, CentOS and Red Hat, you, first of all, need to enable the EPEL repository.
$ sudo yum install -y epel-release
Then execute the command:
$ sudo yum install iftop
Or
$ sudo dnf install -y iftop
Install iftop on Fedora
For Fedora, run the command:
$ sudo dnf install -y iftop
Install iftop on Arch Linux / Manjaro
For Arch-based distributions such as Manjaro, Endeavor OS, and Arch Linux to mention a few, run the following pacman command:
$ sudo pacman -S iftop
Let’s now have an overview of some of the common iftop command usages.
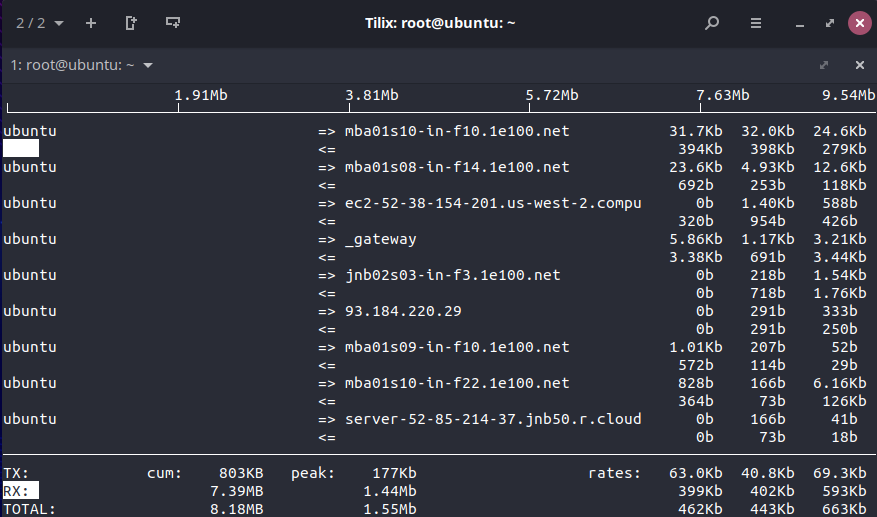
1) Display overall bandwidth usage metrics
Without any arguments, the iftop command displays bandwidth usage of all the network interfaces attached to your system. simply invoke the command:
$ sudo iftop
2) Display bandwidth statistics of a specific network interface
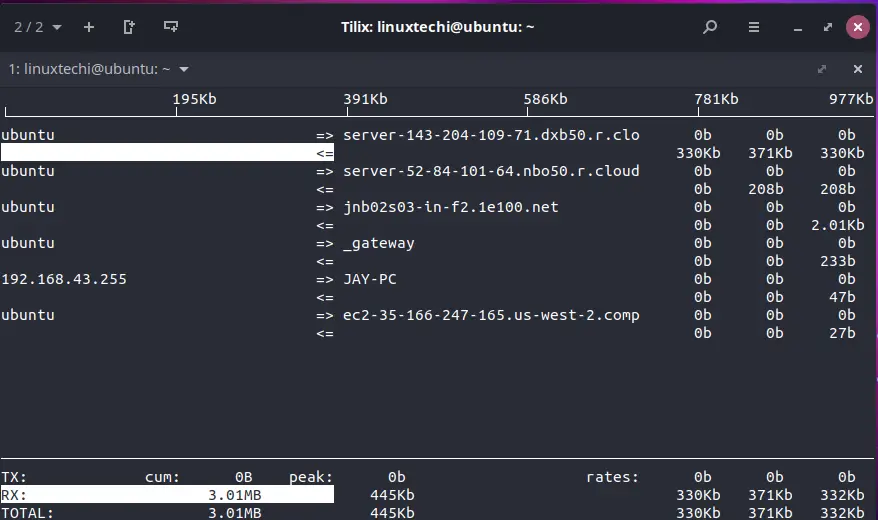
To narrow down and display the statistics of a specific network interface, use the -i flag followed by the interface name. For example, If you want to display the bandwidth activity associated with an interface, say, enp0s8 , run the command:
$ sudo iftop -i enp0s8
3) Disable or hide the top bar graph
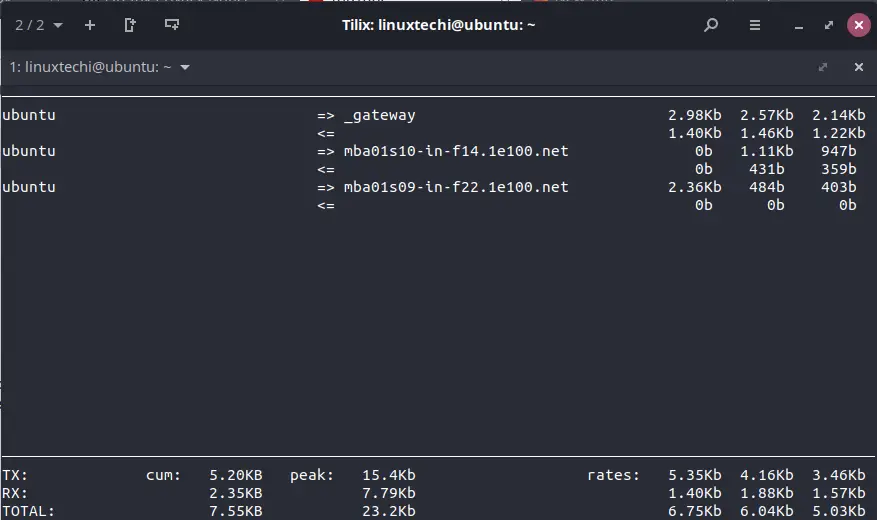
To hide or disable the bandwidth scale or bar located at the top of the terminal, use the -b option.
$ sudo iftop -b
4) Disable hostname lookup
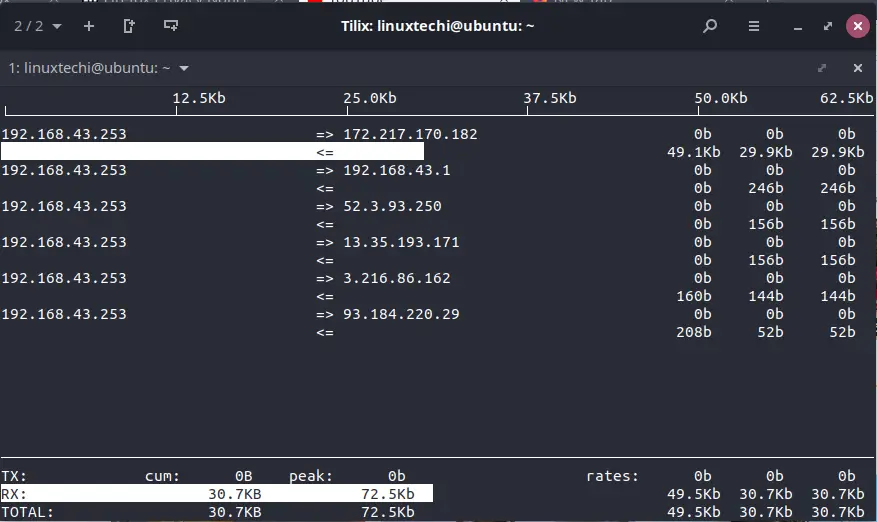
To disable hostname lookup, use the -n option. For instance, the example below ignores the hostname lookup of the sites being accessed using the enp0s8 network interface
$ sudo iftop -n -i enp0s8
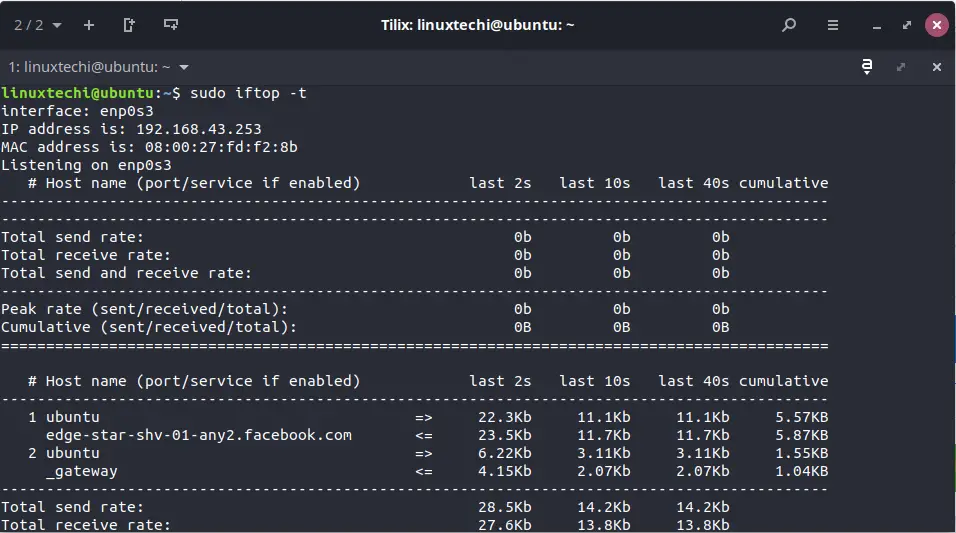
5) Display intuitive text output
To display the output in a more intuitive manner, instead of a tabular format as we have witnessed in previous examples, use the -t option shown.
$ sudo iftop -t
6) Display traffic flowing in and out of a subnet
If you are in a subnet, say, 192.168.2.0/24, and you want to analyze inbound and outbound network traffic, run the command:
$ sudo iftop -F 192.168.2.0/24
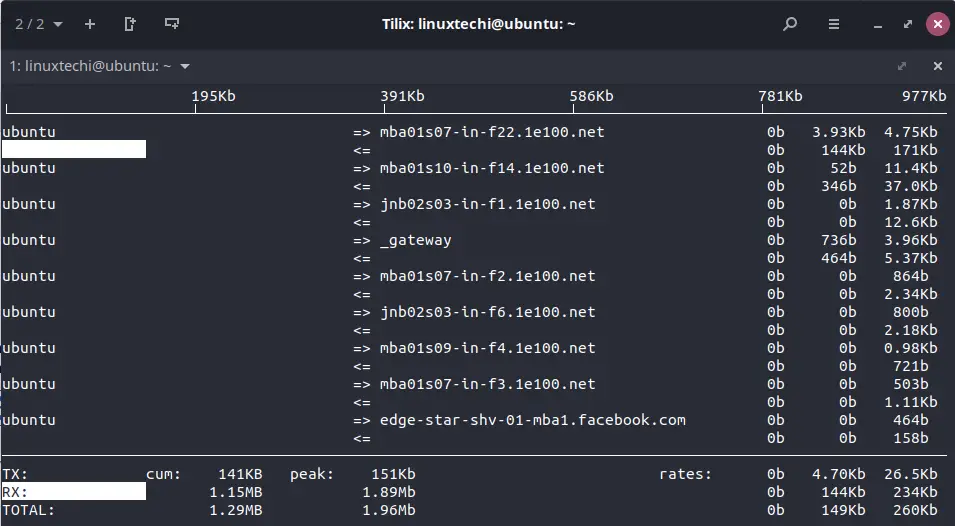
7) Sort the displayed output by source address
If you wish to sort the traffic analysis data based on the source addresses run the command:
$ sudo iftop -o source
8) Sort displayed output by destination address
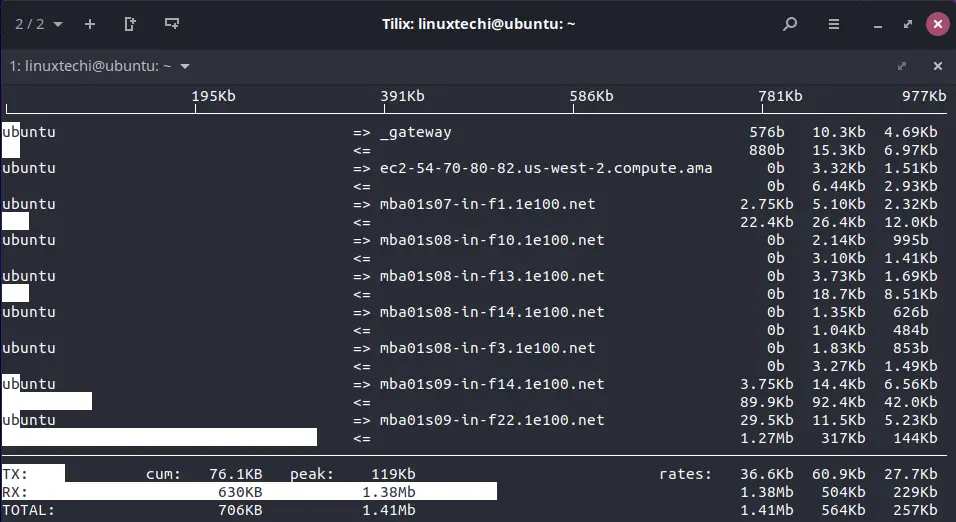
Conversely, to sort the traffic by destination address, run:
$ sudo iftop -o destination
9) Display bandwidth usage in bytes
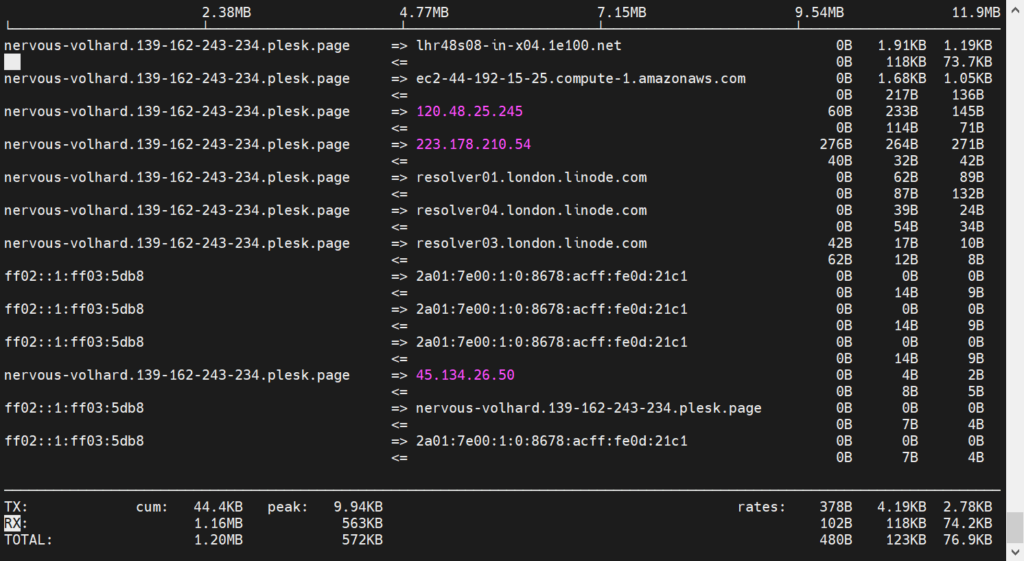
To display the bandwidth usage of lan card, use -B option followed by interface, example is shown below
$ sudo iftop -B -i enp0s8
Sample output
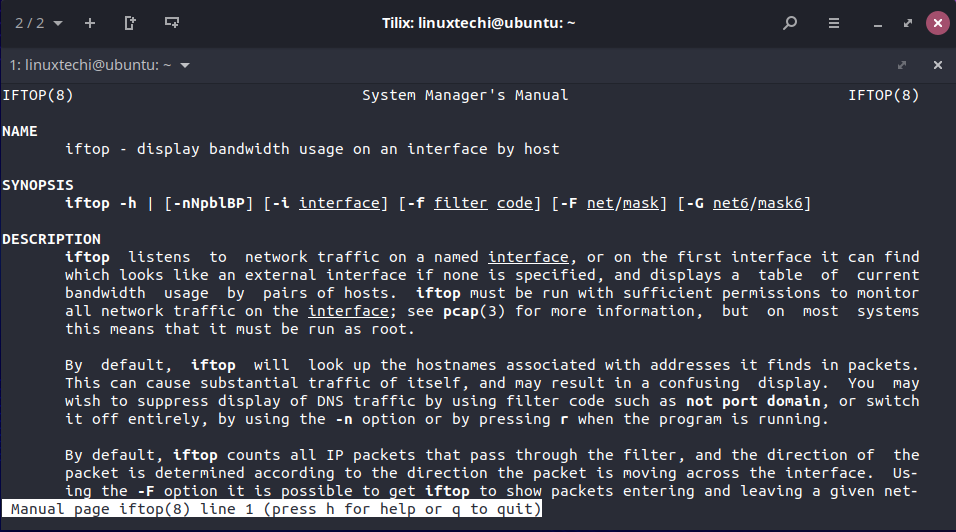
10) Display man pages
For getting more help on iftop command then refer its man page.
$ man iftop
That’s all from this, please do share your feedback and queries in below comments section.
The post 10 iftop Command Examples in Linux first appeared on LinuxTechi.
