Btop++: Linux System Monitoring Tool That is Definitely Better than Top
The omnipresent top command is often the first tool that comes to mind for system resource monitoring in the Linux command line.
Btop++ is a similar Linux system monitoring tool that shows usage statistics for processor, memory, disk, network, and processes.
It is a C++ variant of the popular bashtop from the same developer. In fact, the developer states that Btop++ is a continuation of bashtop and bpytop.
What makes Btop++ interesting
0:00
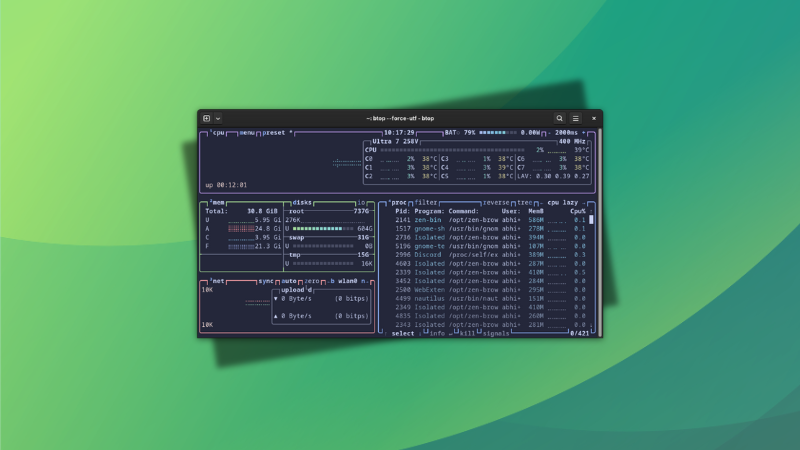
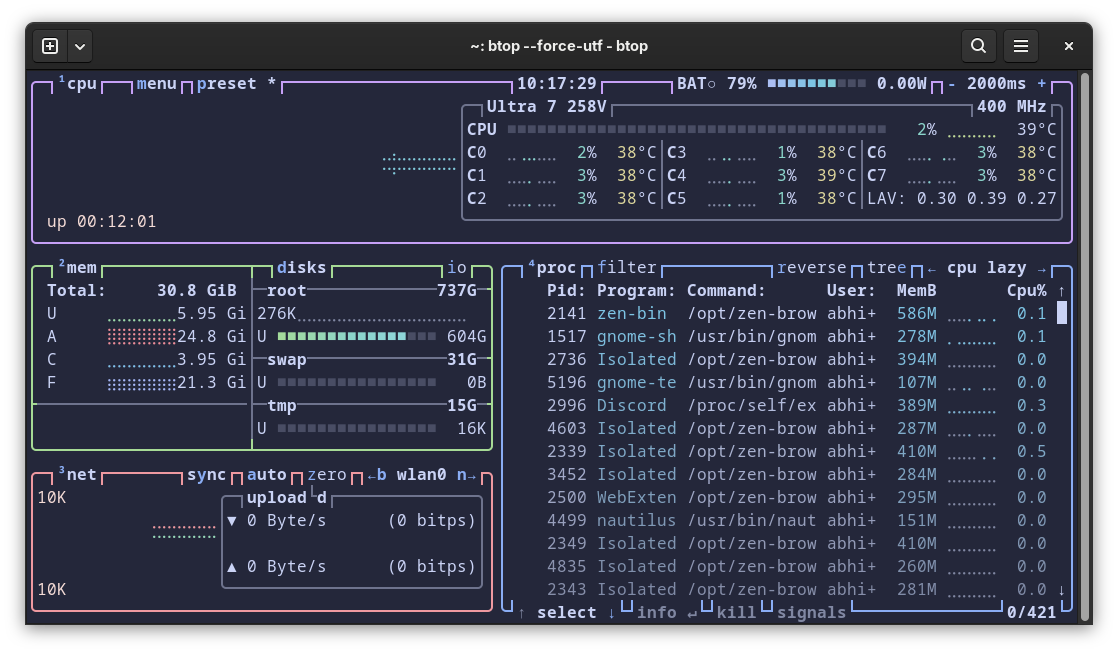
Btop++ default
Here are a few things that make btop++ a better choice than the top command:
- Full mouse support, with clicks and scrolling
- Function for showing detailed stats for selected process.
- Fast, easy to use user interface.
- Ability to filter processes.
- Shows IO activity and speeds for disks.
Installation
Btop++ is available in the official repositories of most Linux distributions.
In Ubuntu 22.04 and above, you can use the following command to install it:
sudo apt install btopIf you are using Fedora, here is the command for you:
sudo dnf install btopAnd, for Arch Linux users, you can use this:
sudo pacman -Syu btop🪛 Troubleshooting tip: No UTF-8 locale detected
When I first ran btop++ on an Arch Linux system, I encountered a “No UTF-8 locale detected” error.
ERROR: No UTF-8 locale detected!
Use --force-utf argument to force start if you're sure your terminal can handle it.
To solve this, either run:
btop --force-utfOr, edit your ~/.bashrc file to add the following line and fix it permanently:
export LANG=en_US.UTF-8Running btop++
To run btop++, open a terminal and run the command:
btopIn desktops like GNOME, there will be a menu entry for btop++ as well.
Explore btop++ interface
While running it, you can see that several letters appearing in the title portions of the interface appear in a different color.
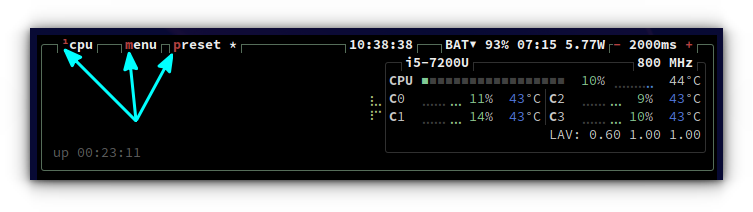
You can press these keys on the keyboard to access the related settings. For example, pressing the m key in the above screenshot will bring a menu screen.
Here, hover over Options and press enter. This will bring up the GUI Settings dialog for btop++.
Btop++ settings
Navigate through the settings using the arrow keys and highlighted characters. The above video shows some settings changes using this btop++ menu.
Some essential Btop functions
In this section, we will take a look at a couple of important usage of Btop as a system monitor and process manager.
Terminate a process
While you are in Btop, press the down or up arrow key to move through the list of processes. When you are above a process you want to terminate, press the t key on your keyboard.
Terminate a process
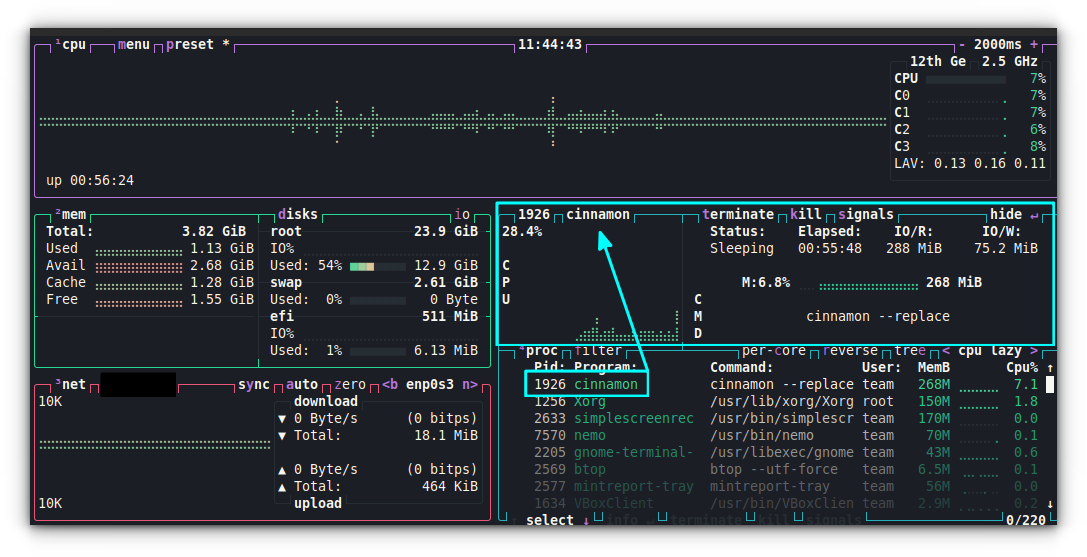
Get more details for a process
You can press the enter key on top of a process to open it in a separate section. This will then give more insight about that process like status, CPU, elapsed time, etc.
Send more signals
If you want to send a different signal to a process, Btop can do that as well. Hover over a process and press the s key on your keyboard.
From the list of signal, enter a number. That’s it!
Send more signals
Configuring Btop++
All options in btop++ are configurable via the TUI menu. Still, btop++ provides a text-based configuration file as well.
You can find this autogenerated config file at ~/.config/btop/btop.conf.
Edit this file in any of your favorite text editors to modify it.
Changing the theme
You’ll may come across some themes that are specifically created for btop++. For example, I am a fan of Catppuccin theme these days and I was glad to see a btop theme in this color palette.
Here’s what you should do for changing the theme. Get the .theme files. For Catppuccin, go to their release page and grab the latest themes.tar.gz file.
Extract it and you’ll see four variants of the theme. Either copy all of them or the one of your choice (you can see what it looks like on the GitHub repo) to ~/.config/btop/themes folder.
Next, edit the file ~/.config/btop/btop.conf and change the color_theme = "Default" line to:
color_theme = "catppuccin_macchiato"The above will change the theme to Catppuccin Macchiato.
Getting help
The best way to get help in btop is by using its TUI menu. While running btop, press the ESC key.
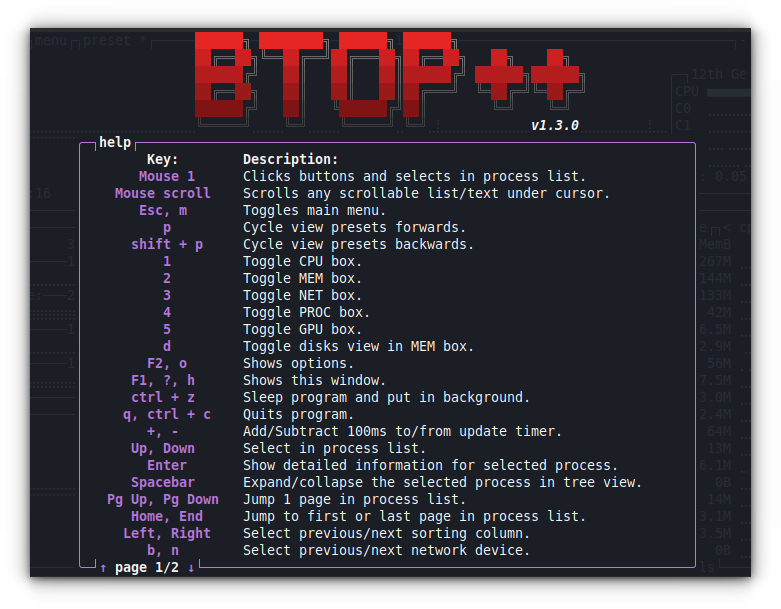
Now, from the list, select HELP.
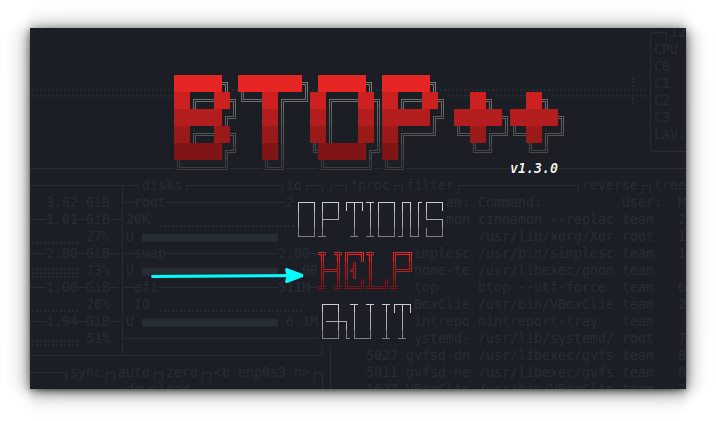
This will print the help window with necessary keys and their functions.
Wrapping Up
For many Linux users, htop is the better top. However, Btop++ is a pretty nice system monitor too. If you do not like to use GUI resource monitors, and want something fast, this is a nice option to have. Alternatively, you may also explore glances.